What is Velocity?
In our regular lives, we generally think of velocity as speed. (Except for physicists, who know velocity is speed plus direction). In the U.S., speed is usually expressed as miles per hour. Every mile is the same length as every other mile. When I’m hiking, the uphill miles may take longer, so my velocity varies, but every mile is still a mile long. Agile projects usually measure velocity in terms of stories or story points per iteration. Unlike miles, each story can be a different size. This creates some uncertainty or “squishiness” in the measurement of velocity. Let’s consider this more deeply.
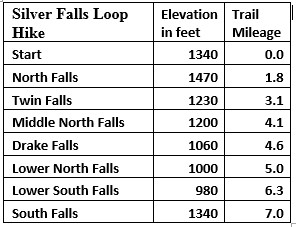
In Silver Falls State Park in Oregon, there’s a lovely day hike which passes a whole series of waterfalls. The waterfalls on the main loop of the Silver Falls Loop Trail are scattered over the distance, as shown here.
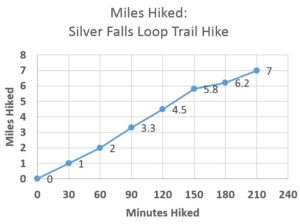
If I hiked the Silver Falls Loop Trail, with plenty of stops to admire the waterfalls, my velocity might look like the graph below.
After the first two markers, I hike a bit faster because I’m going down a gentle slope. The last mile is a trudge uphill, regaining around 400 feet of elevation in a short distance, so I slow down. Another hiker might have a different average velocity for this trail. On a much steeper trail, I might have a different average velocity. But, a mile is still a mile.
Velocity of an Agile Team
Measuring velocity in an agile team is much trickier, regardless of whether you are measuring velocity in terms of stories or in terms of story points. Unlike miles, each story or story point can be a different size. In effect, your yardstick is squishy – the distance between each unit isn’t standardized. Measuring with a squishy yardstick gives you a measurement with a wider margin of error.
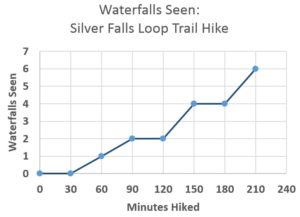
For instance, what if I measured my hike by waterfalls seen? The waterfalls aren’t evenly spaced along the hikes. Like user stories, the effort to reach each waterfall from the last one isn’t the same. This produces a much bumpier velocity. 
I can still calculate an average velocity in terms of waterfalls, but it isn’t going to accurately predict the time it will take to reach a particular waterfall. The same is true of agile velocity – your velocity can accurately predict the total time for a whole bunch of stories, but it’s not that accurate for a particular story.
Some people suggest that we measure velocity by story points completed, and give credit for partially completed stories. This produces a much smoother velocity graph, but you’re actually predicted your ability to do work, not your ability to deliver working software. Others measure by story points, but don’t give credit unless the story was completed. It’s still a bumpy graph, because story points aren’t a fixed length either.
Johanna Rothman suggests that the team measure velocity by stories, and try to keep all the stories small, preferably around one day long. This method eliminates a great many of the problems caused by measuring with a squishy yardstick. Sure, some stories are still larger than other stories, but they aren’t going to be very much larger since they’re all supposed to be one day. The yardstick is less squishy, so the measurement of velocity is more precise, allowing the team to estimate more precisely how many stories they can do.
Learn More
More thoughts about how to measure: http://kaner.com/pdfs/rethinking_sw_metrics.pdf
Does your definition of velocity include bug fixes? Should it? A thoughtful discussion: https://www.mountaingoatsoftware.com/blog/know-exactly-what-velocity-means-to-your-scrum-team
Johanna Rothman on 1-day stories: https://www.jrothman.com/mpd/agile/2014/11/three-alternatives-for-making-smaller-stories/

